This section is very outdated (last update 2017). More coming soon.
Building a MRI-compatible device to collect finger force data.

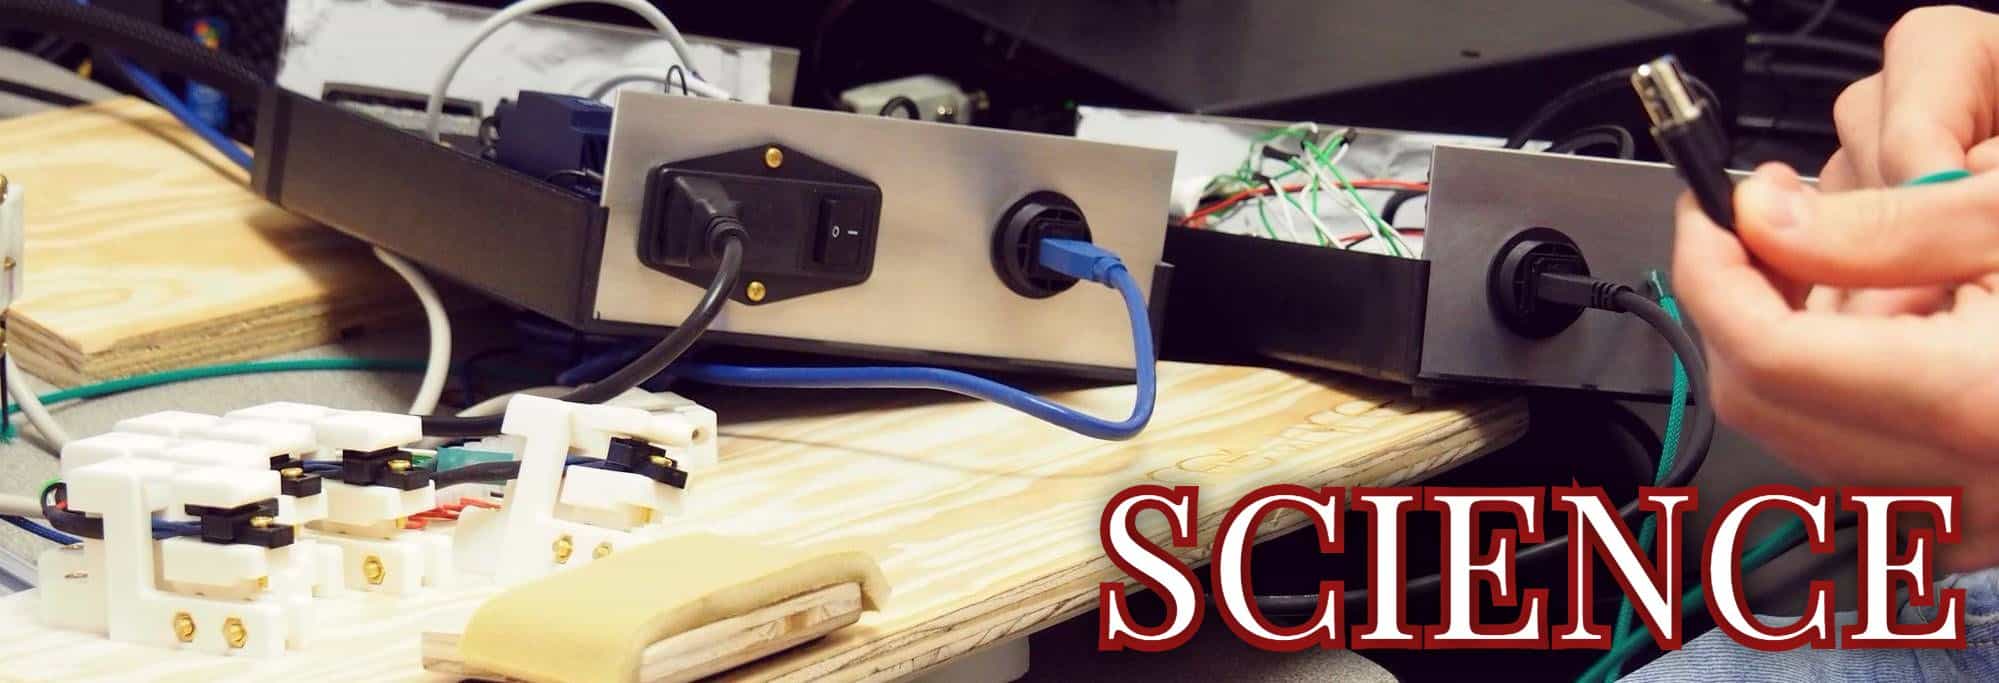
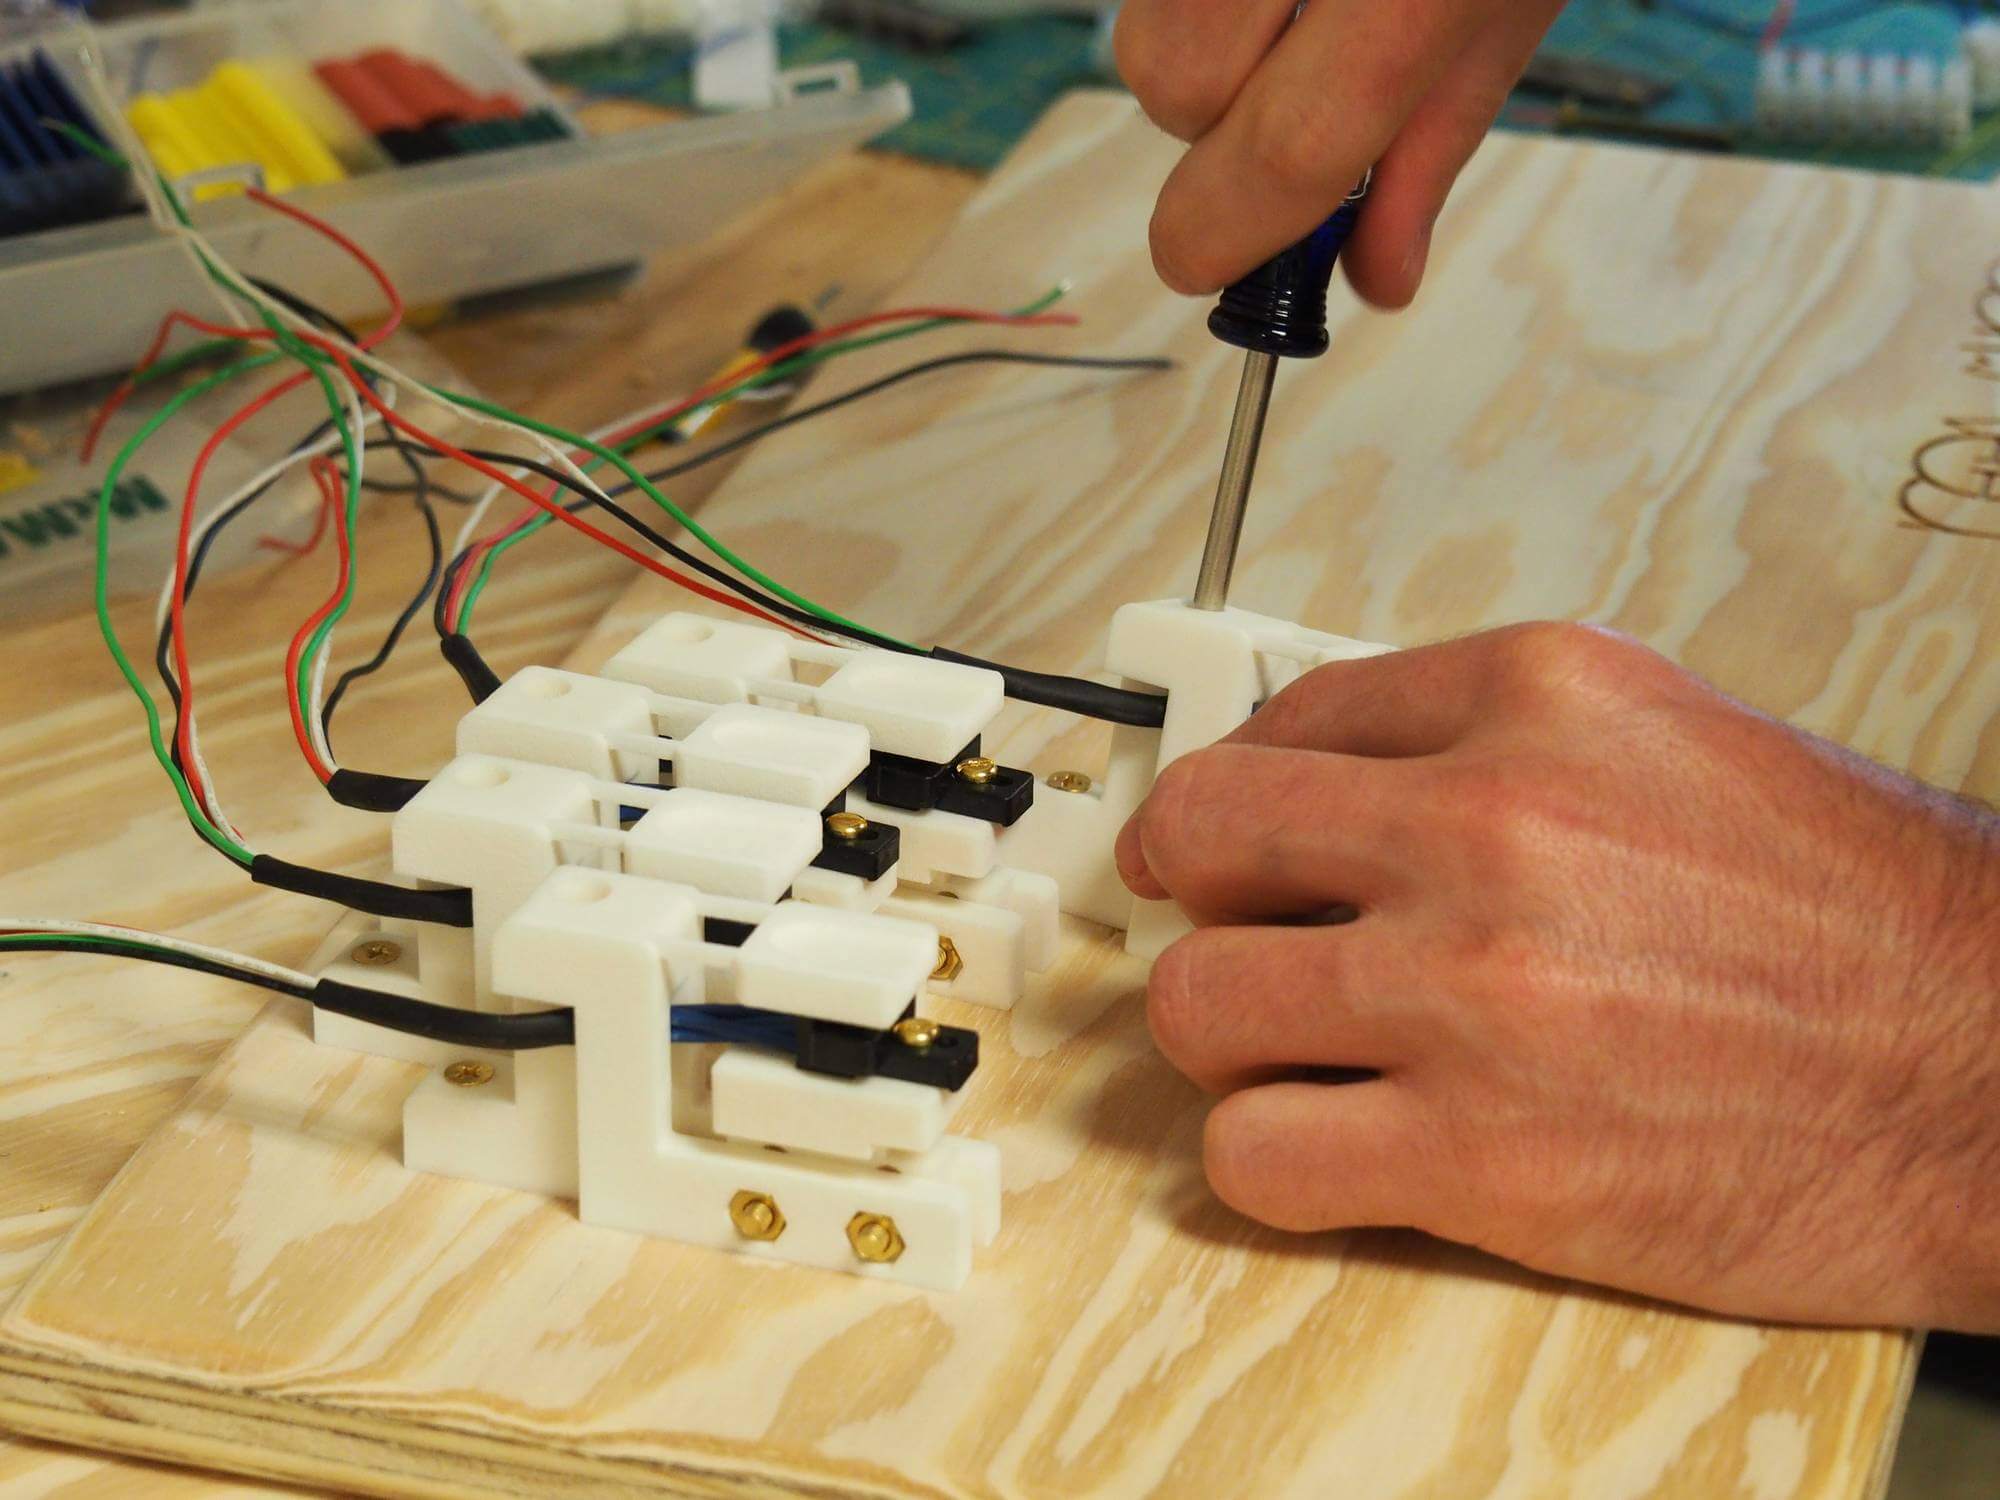
This project was done at the Department of Mechanical Engineering at the University of Texas, Austin. In order to investigate how fine motor control/learning happens in the brain, I needed a keyboard and sensors that would work in a MRI scanner (see top of first picture).The idea was to use a non-metallic material to build the device. It was manufactured in Nylon 12 using Laser-sintering 3D printing. The sensor consists of a spring-like double structure that is able to deflect when a force is applied on the contact surface.
Another keyboard was designed to be equipped with piezoelectric force sensors (see bottom of first picture). In addition to serve as a reference for its MRI-compatible counterpart, it's portable and reliable.

Nylon 12 was selected for its specific mechanical properties allowing to design a very sensitive sensor. To summarize, the deflection is measured in real time by an optic fiber as the variation of distance between the head of the fiber and the mirror (attached to the sensor's central part) results in a variation of light intensity. The signal is converted to a voltage from which a force in Newton is extrapolated.All the electronic parts are located outside the scanner, preventing the signal from being affected by the magnetic field.
This system became the experimental set up to investigate neurofeedback-based training in the MRI scanner and be applied to improve stroke rehabilitation. Extensive description of this work is included in my master's thesis.Download PDF and Powerpoint (French only!)
See below further pictures related to this research.
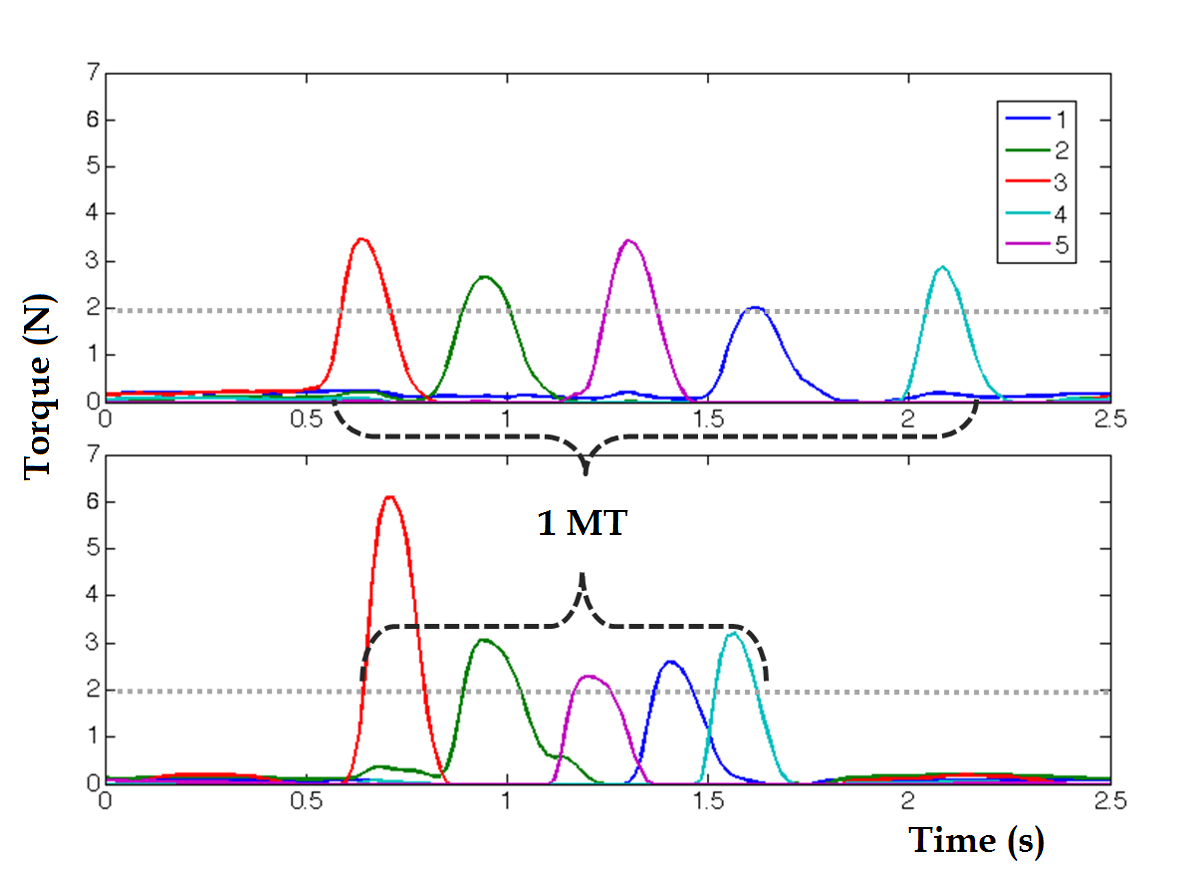
An example of force recording plot: Each color corresponds to a finger (1 for pinky,.. 5 for thumb). The figures shows the decrease in Movement Time (MT) along practice time. Fingers overlapping each others can be seen in the second plot.
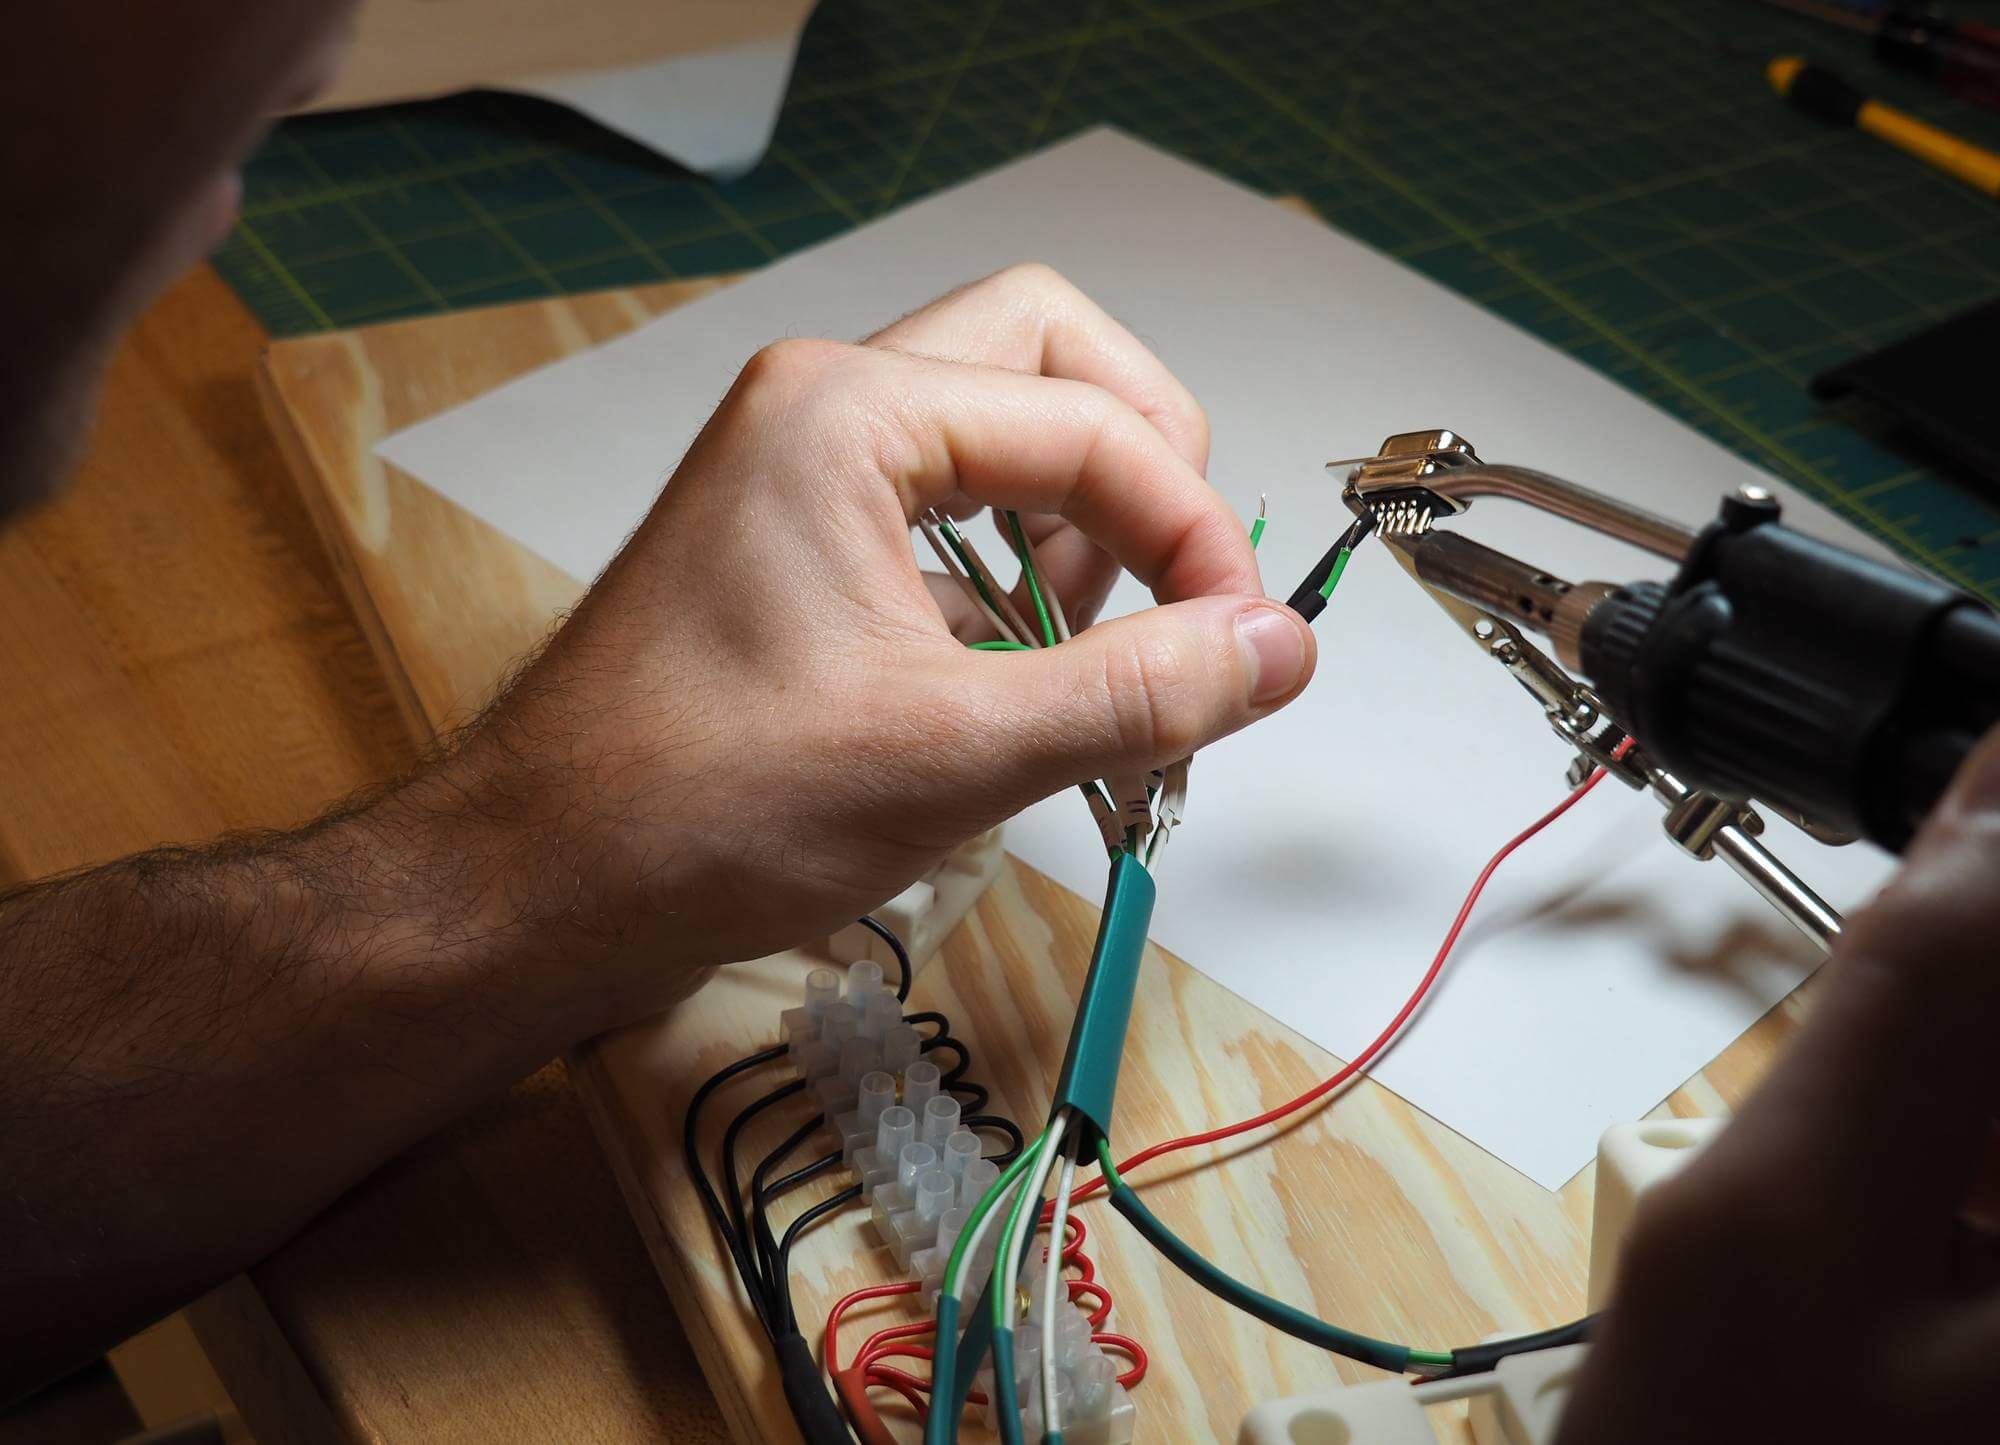
Close-up and manufacturing of the piezoelectric keyboard.
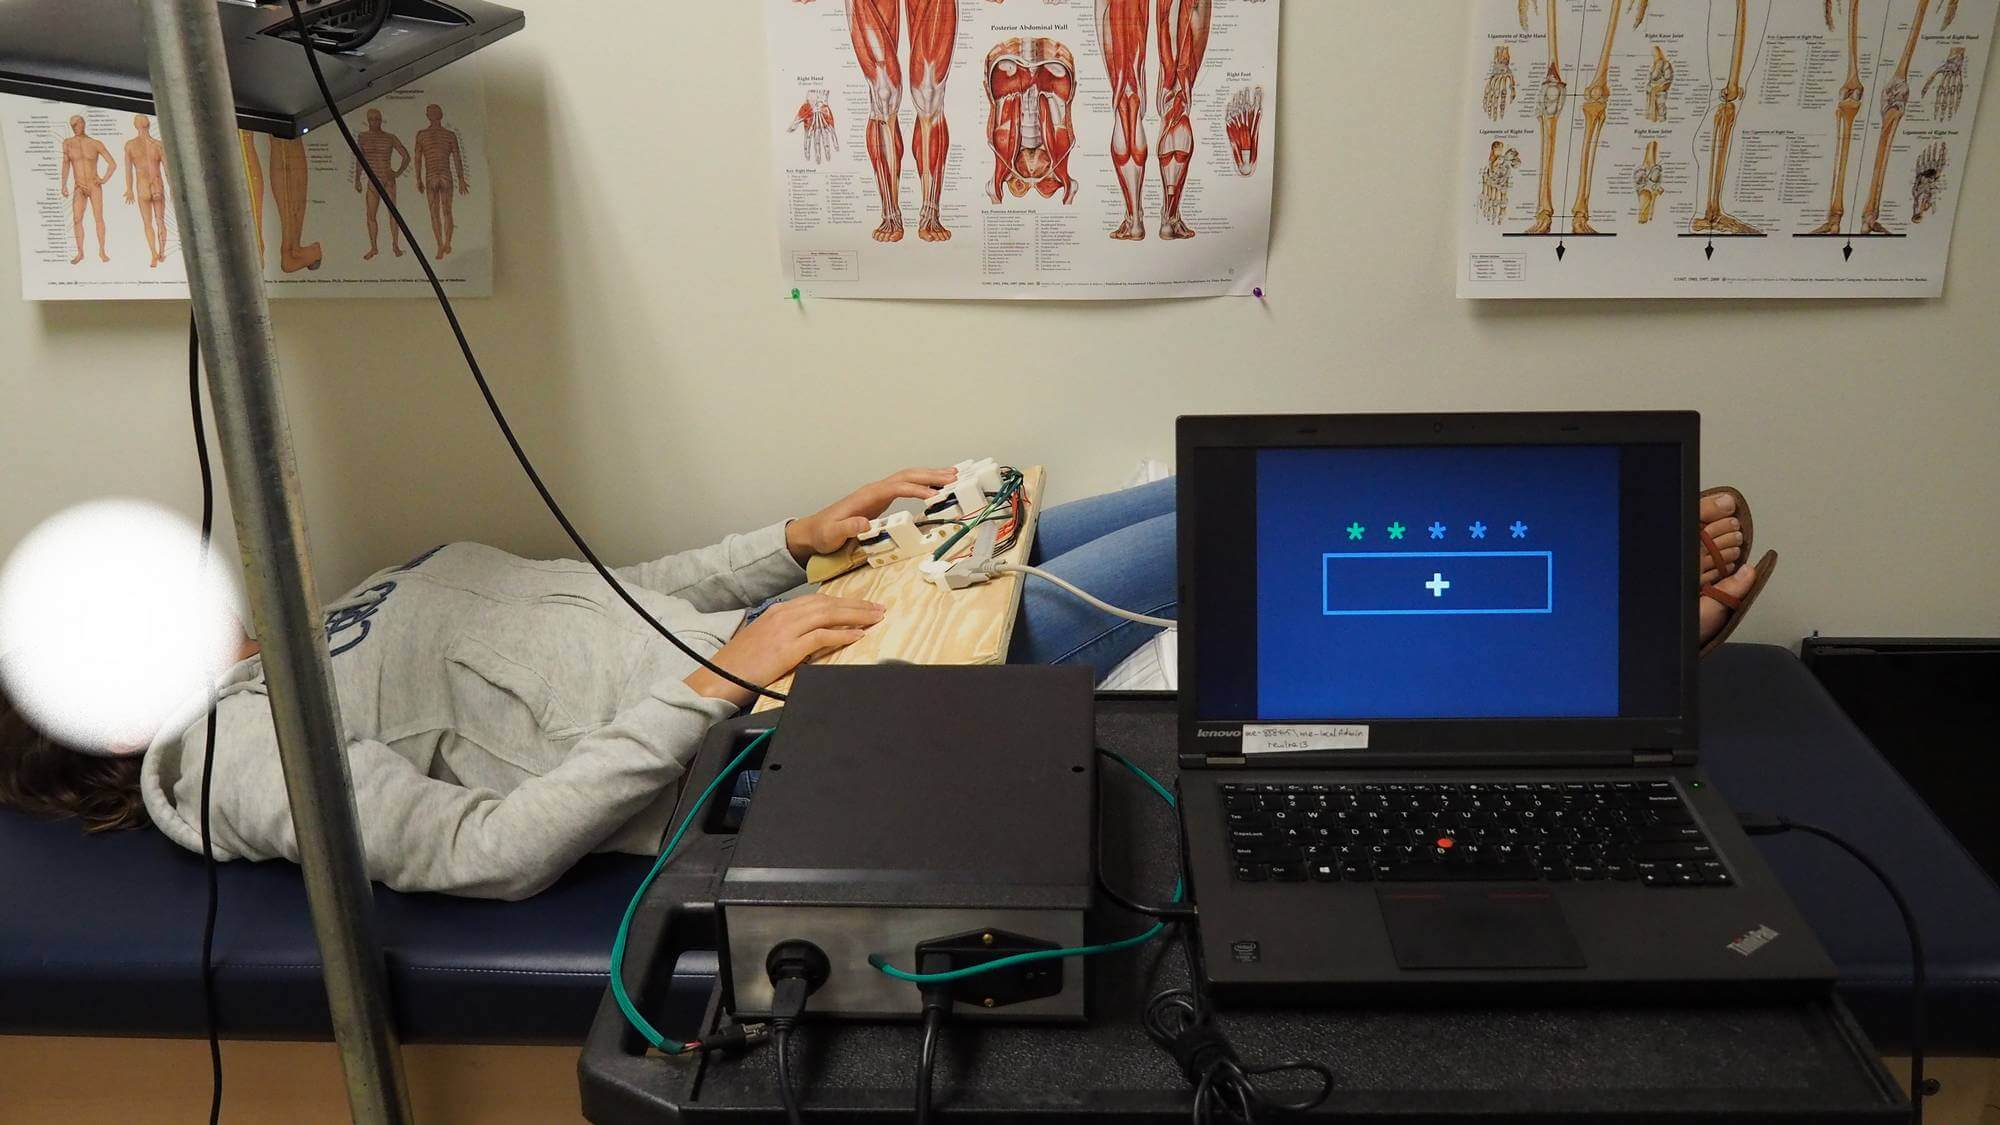
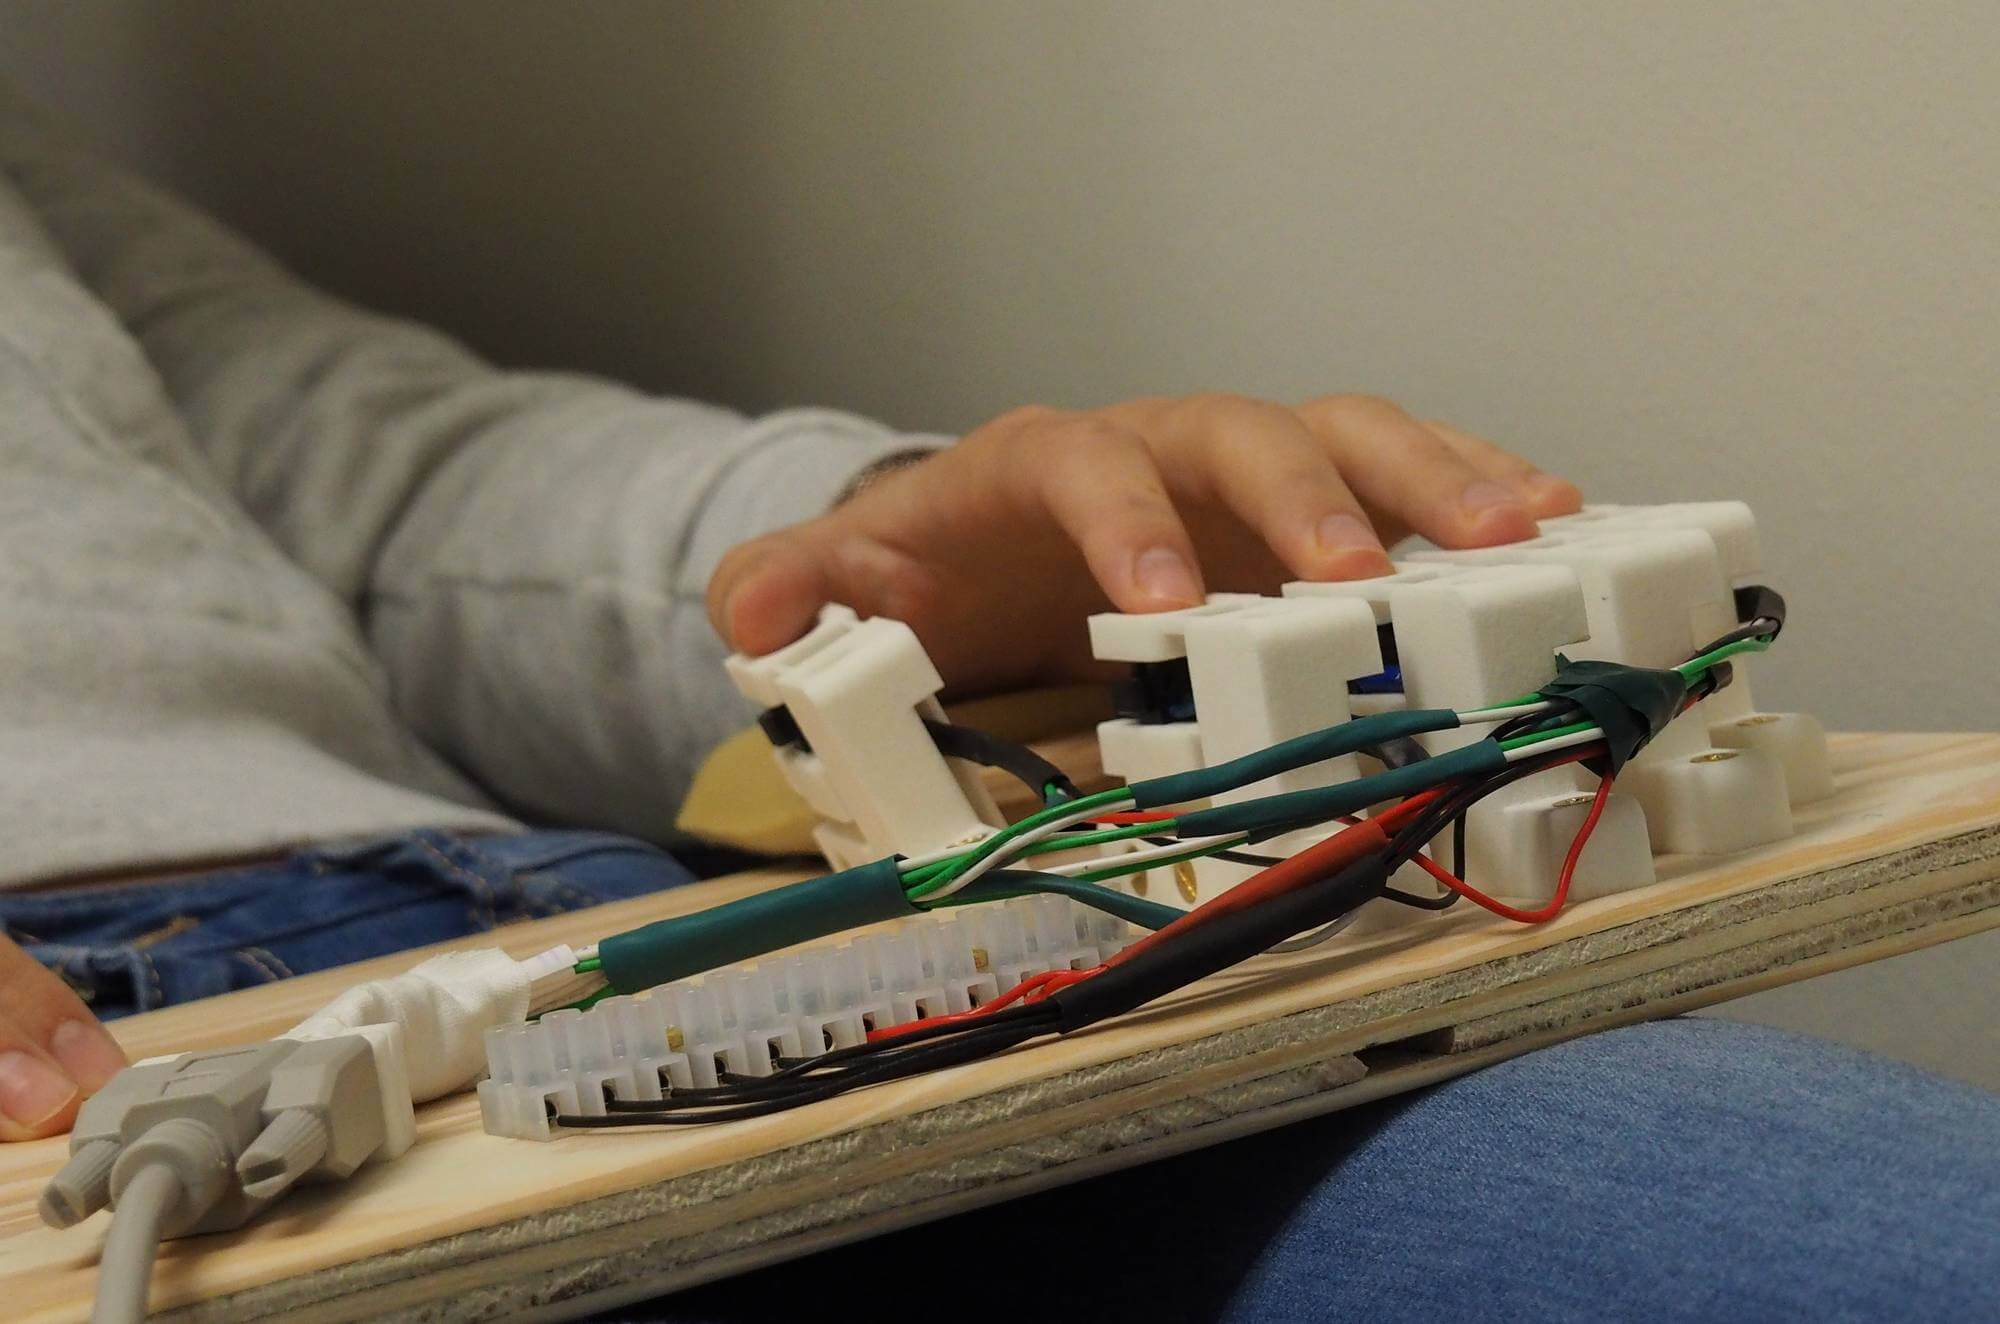
Familiarization phase set-up in the lab. Position and general ergonomy match the procedure inside the scanner.
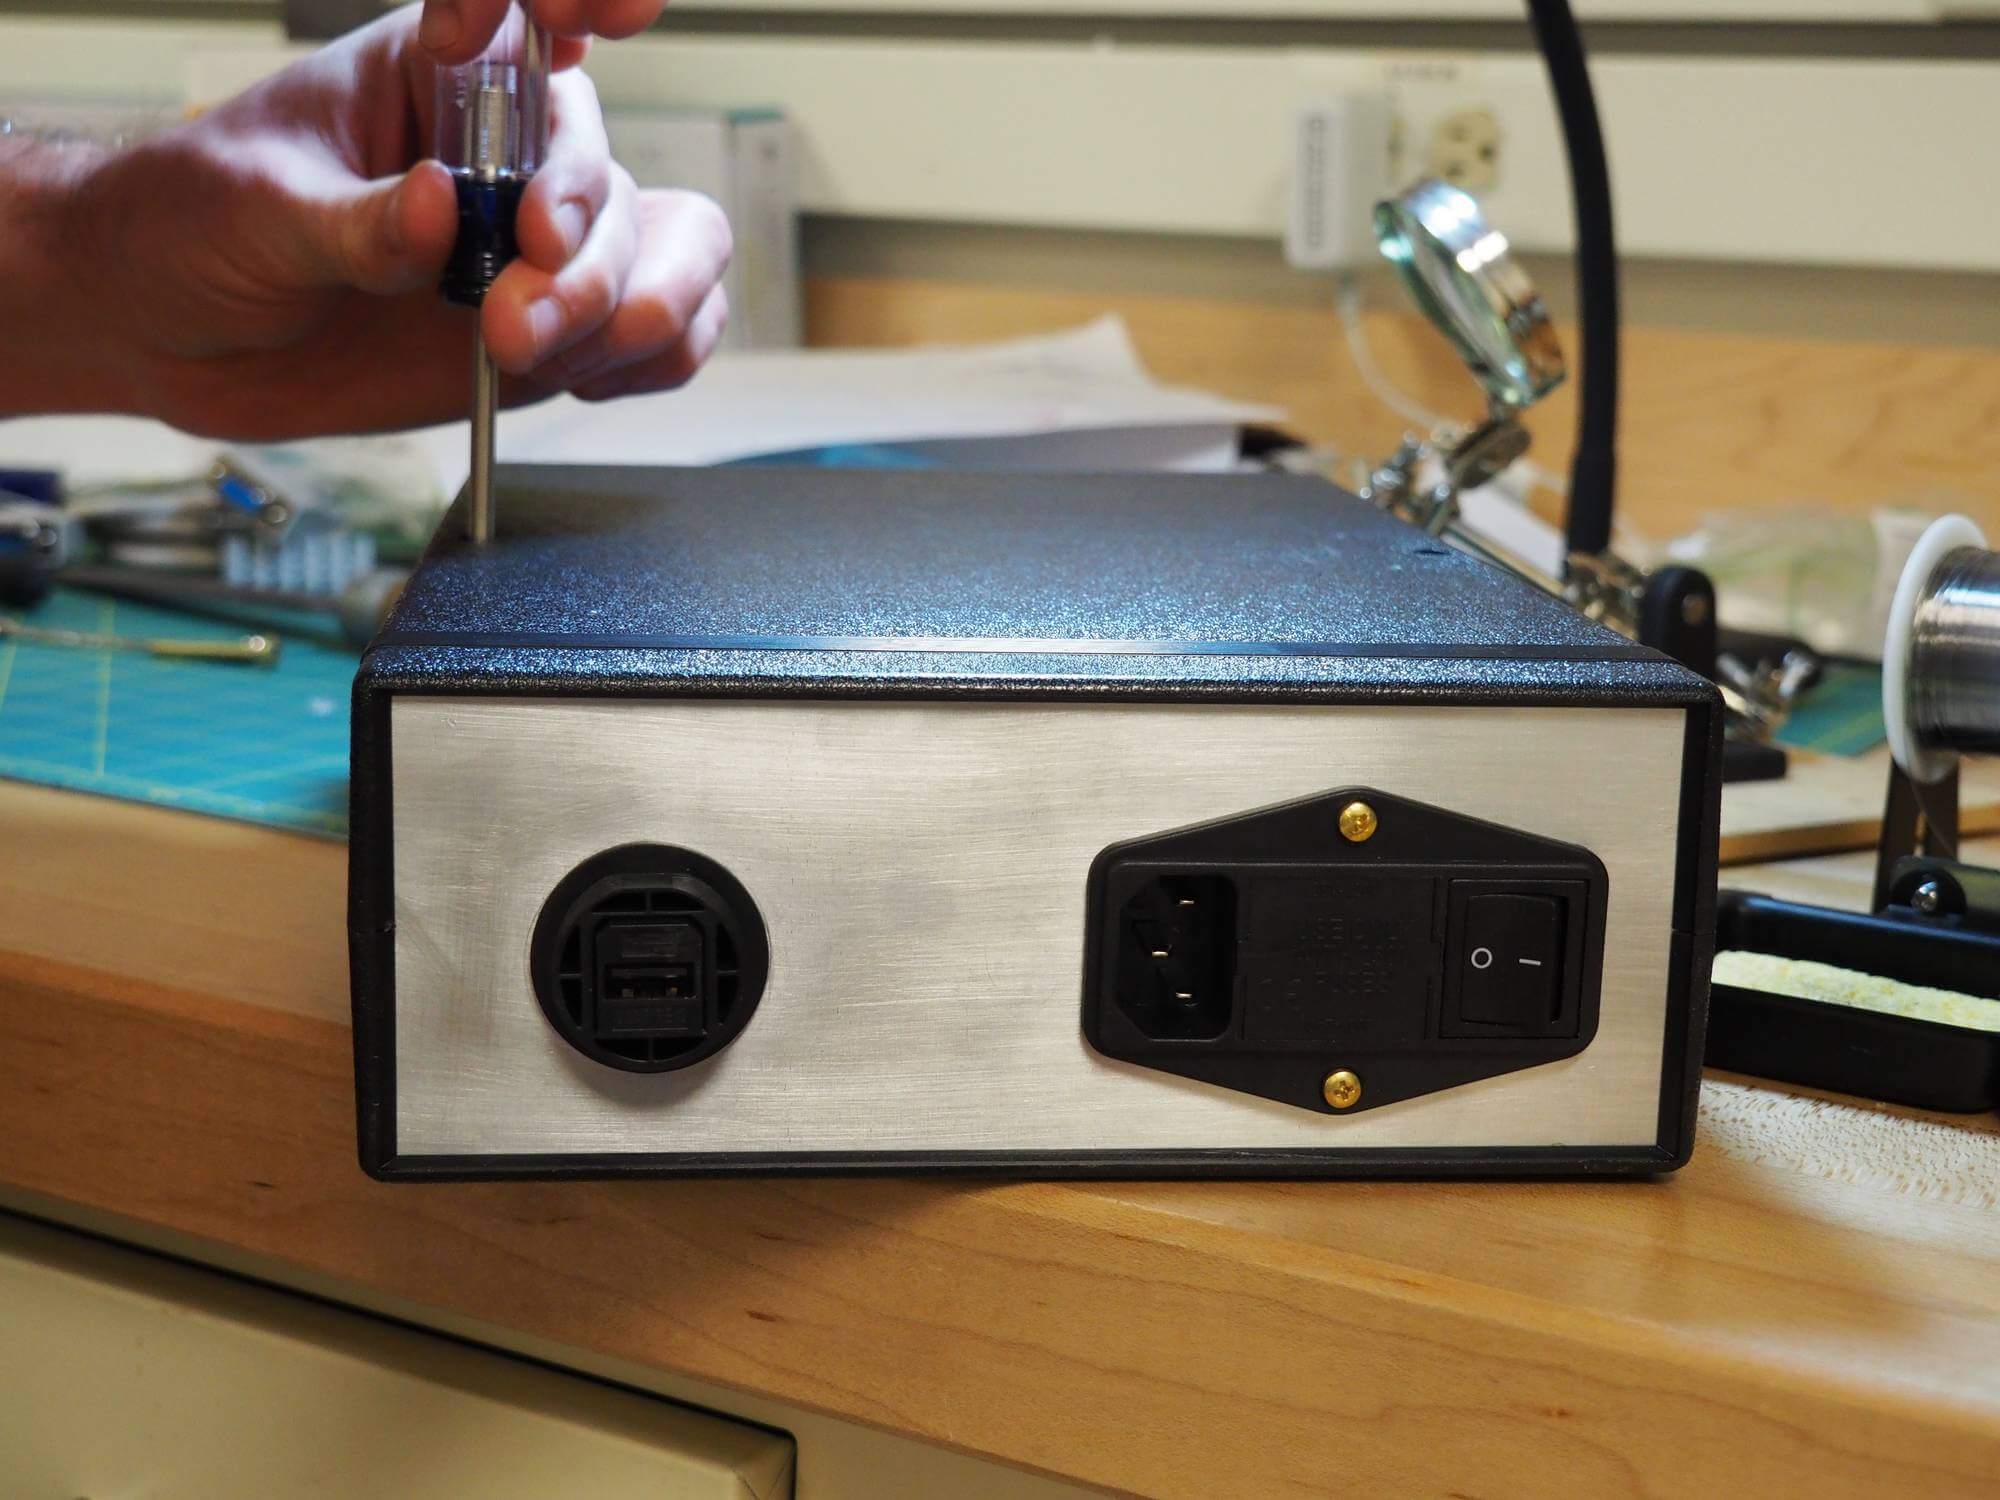
Finishing keyboard and command box.
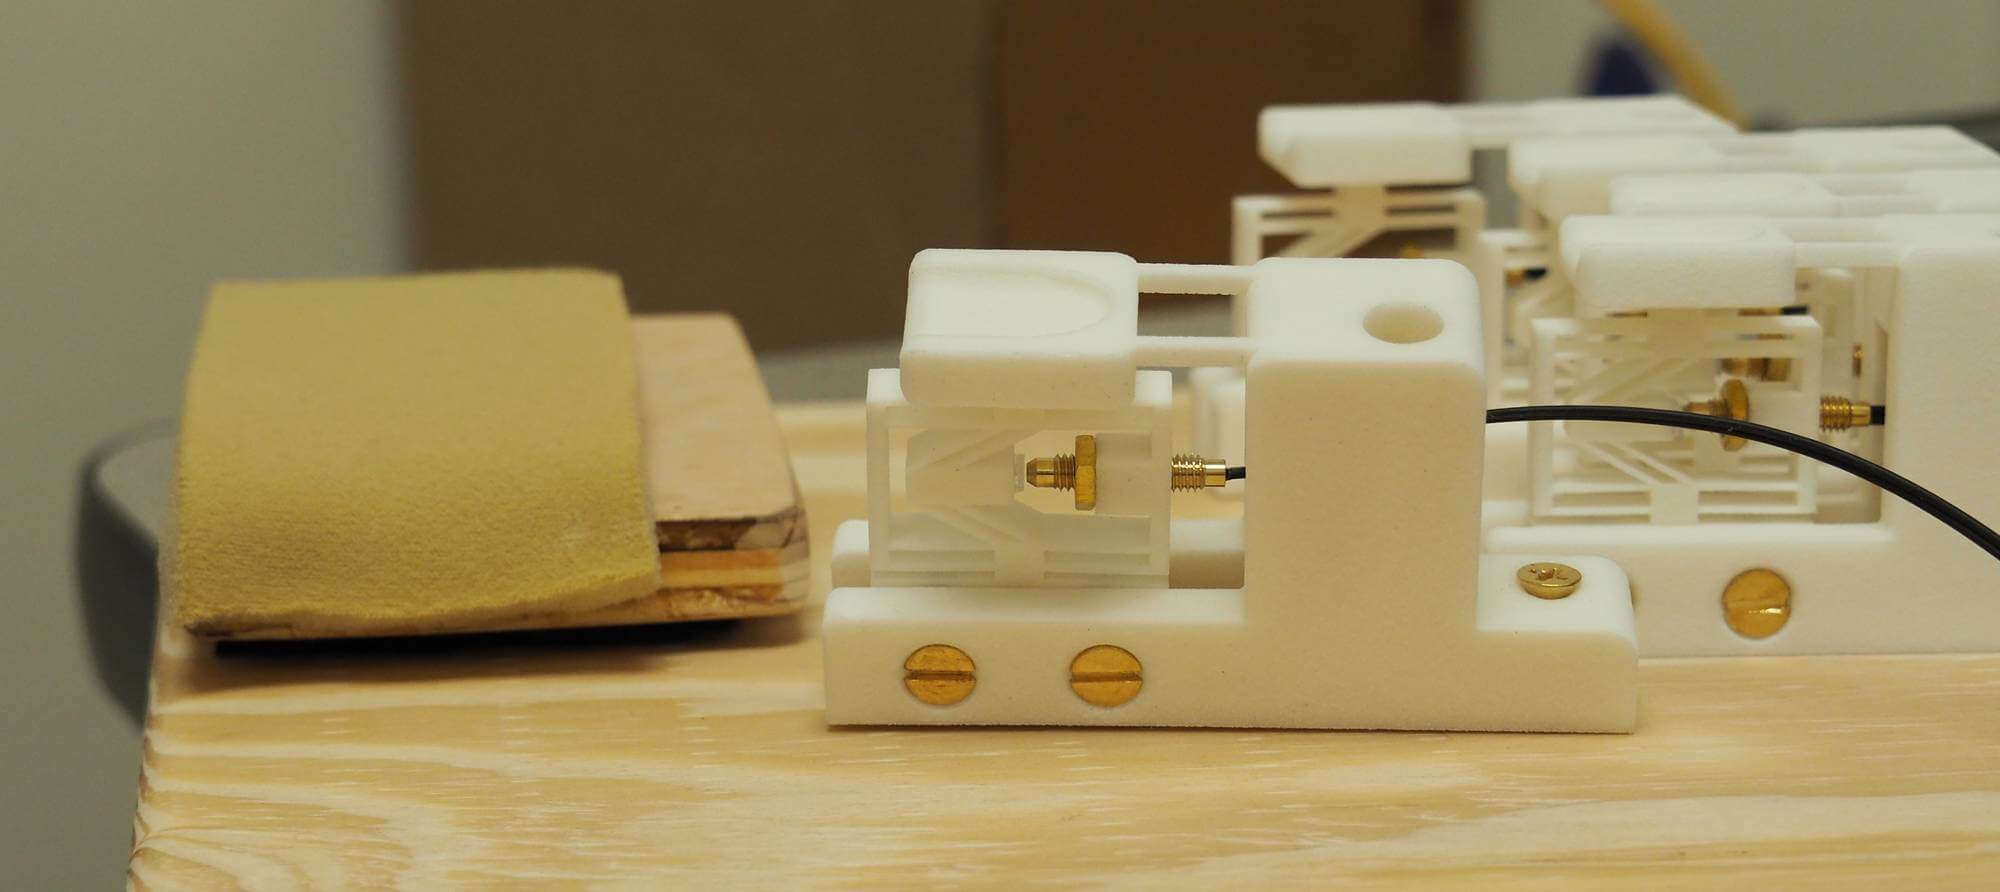
Close-up of a key equipped with the custom optical force sensor. This one is inclined to match the thumb's flexion angle.Adjustable wrist padding can also be seen on the left.
Using machine learning classifiers to decode patterns of brain activity.
Before being able to investigate neurofeedback on motor learning, we needed to decode the brain activity associated with the execution of finger sequences.
First step was to select finger sequences based on specific criteria (it was done in MatLab):
A pilot experiment was conducted over the 19 sequences obtained to test consistency in difficulty (as assessed by MT and error rate).
See figure below:
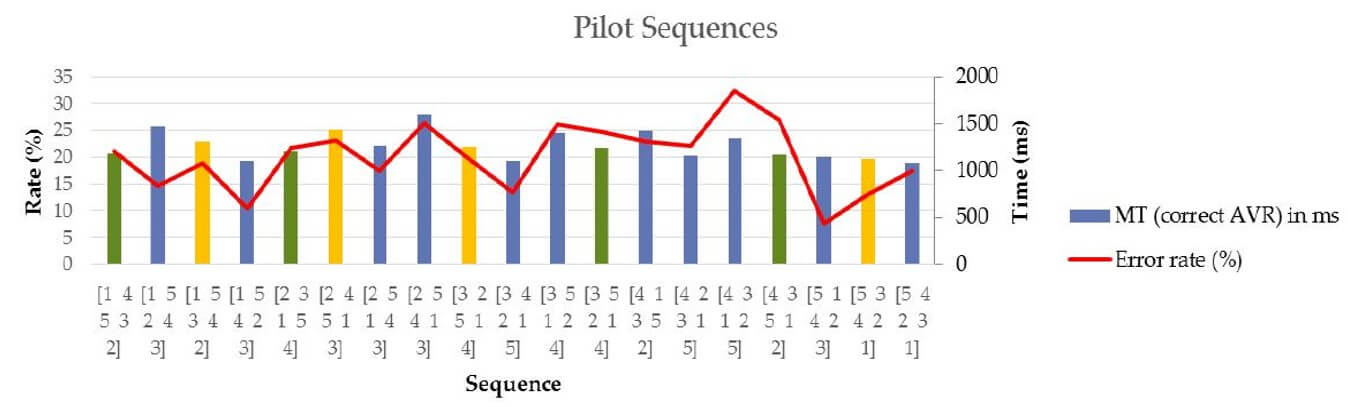
Pilot experiment results; n = 8 subjects, MT is movement time. Sequences in yellow were selected for training (familiarization) while those in green were the one used inside the scanner.

Custom animation made to represent what the data is put through from being collected (as a voxel) to getting selected in a classifier, as showed by the matrix (n=classes/sequences ; m=voxels).
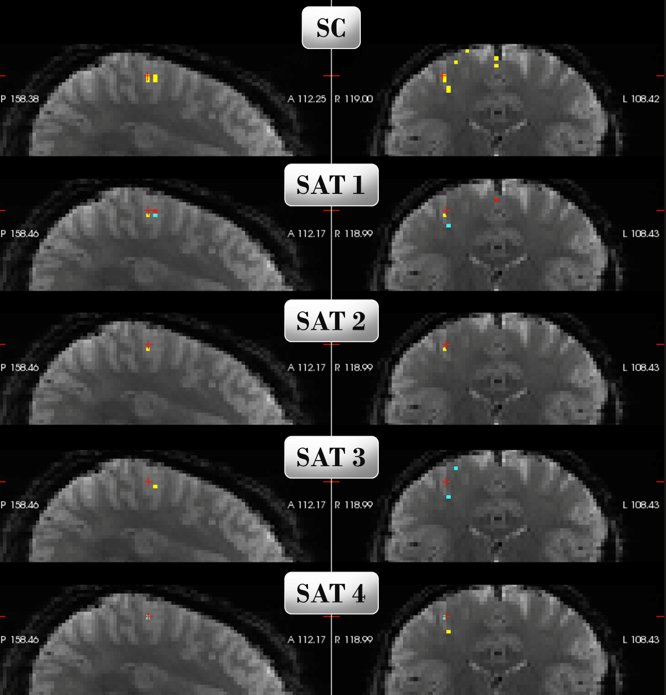
Here is a graphic representation of the classifier:
SC corresponds to every voxel selected by Selection Count to be part of the classifier. Each SAT is one of the four finger sequences tested. The voxel's color gradient represents its measured level of activity.
For instance, this particular classifier has a decoding accuracy of 58.7% when tested on samples from another scanner session.
This is especially good for a class 4 classifier considering that participant's head alignment inside the scanner between session has to be taken into account.
However, outcomes weren't as good when testing on both hemispheres and/or different regions of interest. Ultimately, what accounts the most for decoding is the quality of samples collected to train the classifier. Further improvements need to be done before applying the neurofeedback paradigm. For more details please see my master's thesis.
See below an animated representation of the experimental paradigm:

Testing whether the bold signal can be modulated via operant conditioning-based neurofeedback to induce motor learning.
Evaluating NIRX©: Near-Infrared Spectroscopy (fNIRS) to measure brain activation.
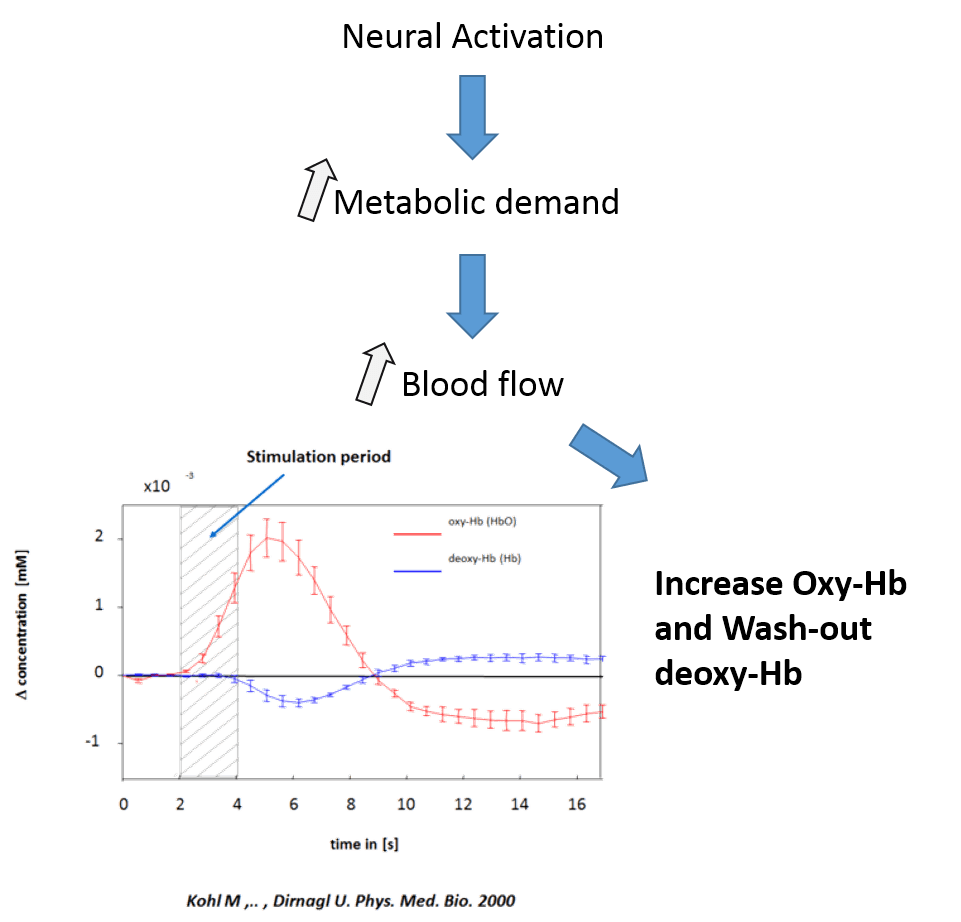
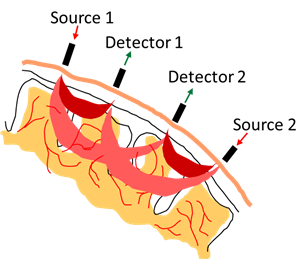
Functional near-infrared spectroscopy uses the properties of infrared light to measure local variations in blood oxygenation.
This method takes advantage of the optical window in which skin, tissue, and bone are mostly transparent to NIR light in the spectrum of 700-900 nm, while hemoglobin (Hb) and deoxygenated-hemoglobin (deoxy-Hb) are stronger absorbers of light.
Similarly to fMRI, fNIRS relies on the principle of neuro-vascular coupling also known as BOLD (Blood-Oxygenation-Level-Dependent) response to extrapolate changes in neuronal activity (see right figure).
While studies relating fMRI and fNIR show highly correlated results in cognitive tasks (Cui et al. 2010), I aimed to evaluate the suitability of this system provided by NIRX© to measure movement-related brain activation.
Several conditions were investigated:
Pros: High temporal resolution, non invasive, portable, easy to set up.
Cons: Low spatial resolution, limited depth of signal, artifacts.
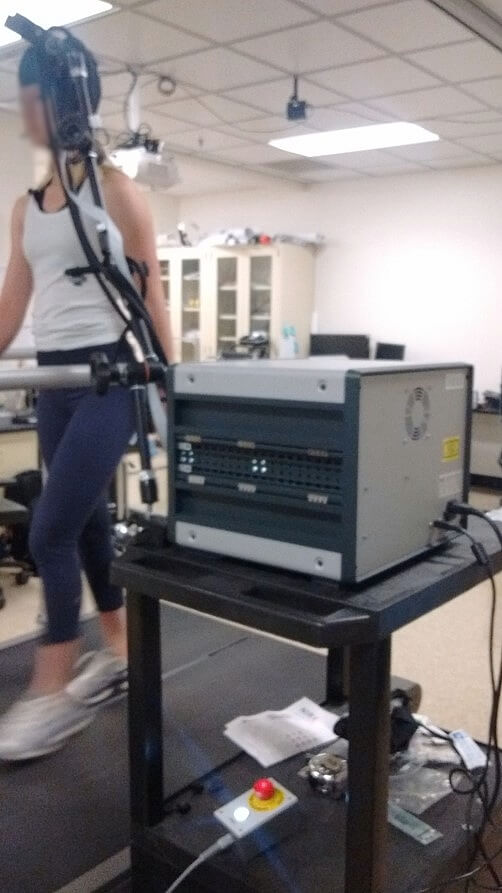
Experimental set up for Symmetrical/Asymmetrical walking on treadmill (see picture on the left) :
This protocol includes 3 blocs :
- 1. Standing rest (baseline).
- 2. Asymmetrical walking, one leg at 1.3 m/h and the other at 0.7 m/h.
- 3. Symmetrical walking, both legs at 1 m/h.
Each bloc lasts 30 sec, every third blocs it goes back to baseline. For the two walking blocs, order of appearance is randomized as well as which leg is slowed during asymmetrical walking.
During the experiment, participants are instructed to look at a monitor that gives a cue a few seconds before a switch (so they don't collapse !).
Timing was simultaneously recorded in order to post-syncronize brain recording data and behavior.
Raw data was processed using NIRX software and analysed using SPM.
See below results and further related pictures.
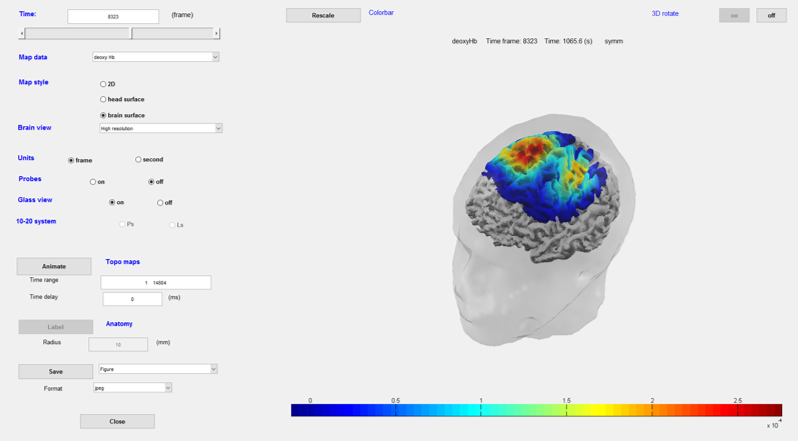
Pre-processed data roughly mapped onto the brain surface. Useful to visualize the blocs along with the time course.
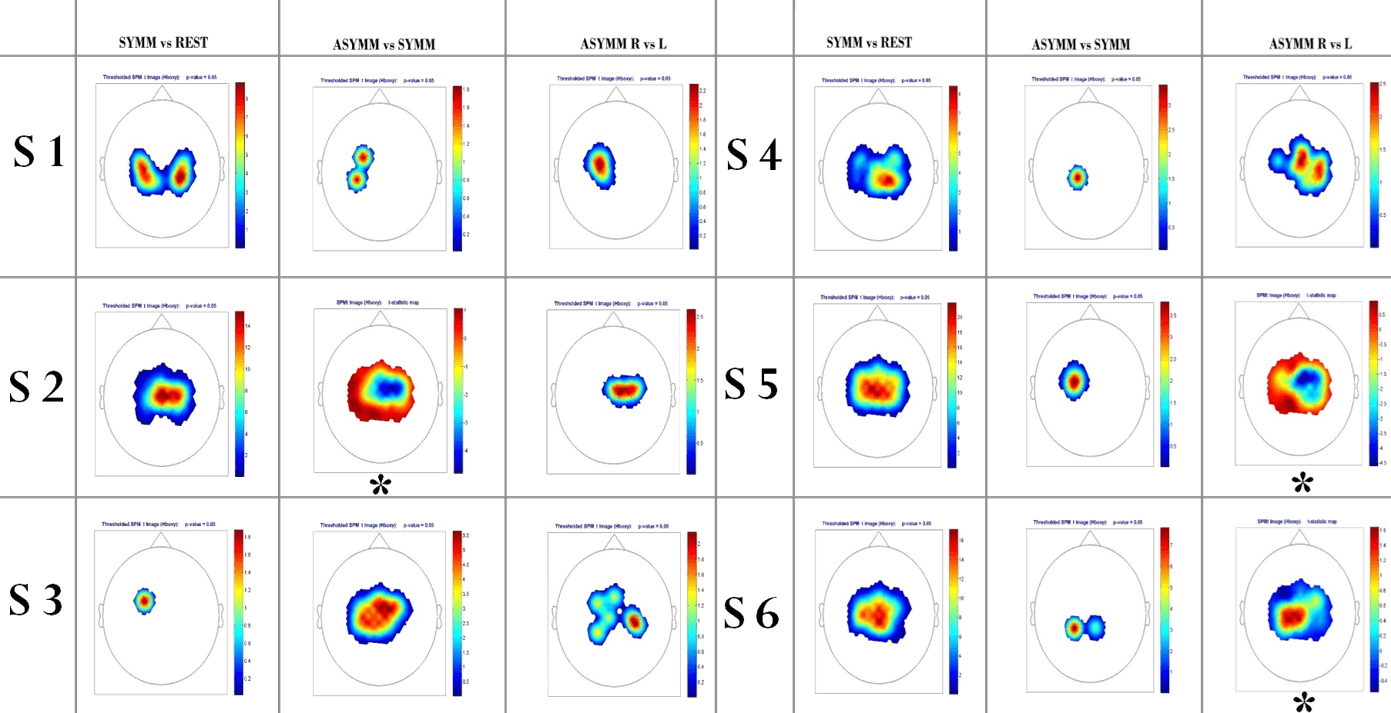
Results for walking experiment : SPM level 1 analysis; each figure represents a statistical map of contrast between 2 conditions (e.g. Symm vs Rest corresponds to the increase of brain activation compared to Rest, over the whole data set). Aside from those marked with an asterisk, every figures are significant with a P ≤ 0.05.
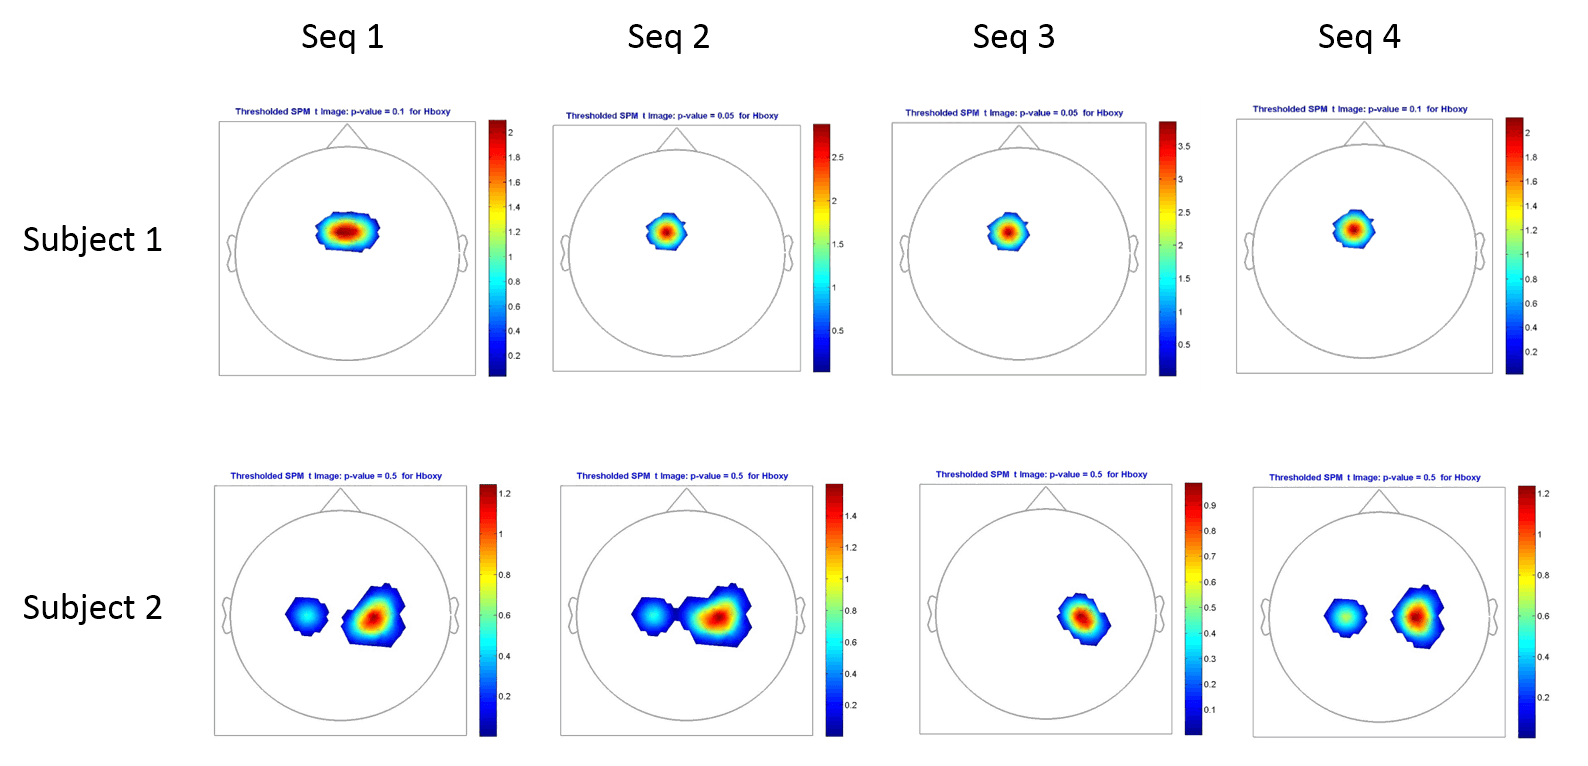
Results for finger sequences comparisons : Each sequence is compared to baseline (rest). Although a trend can be seen, distinguishing sequence from rest, no differences between sequences could be observed. Poor spatial resolution provided by the system (around 1 cm) could account for this result.
Electrocorticography (ECoG) recording of sequence learning.
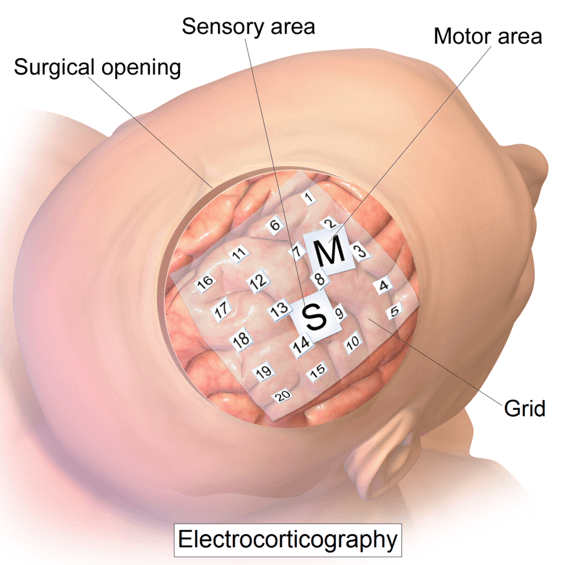
As part of my work on neural correlates of motor learning, I was involved in a collaboration between the Rewire lab and Seton Brain institute.
Using the experimental setup I built, I collected concurrent finger force data and electrical brain activity from patients that had electrodes implanted in their brain.
We hope to publish a paper on this data.
Pros: Higher spatial resolution and signal-to-noise ratio than EEG, higher temporal resolution than fMRI
Cons: Limited sampling time and field of view, invasive.
While being primarly used on epileptic patients during presurgical planning, ECoG has been used as recording technique for Brain-Computer Interfaces investigations (Leuthardt and al, 2004).
I wrote a one-page report to define the project as well as the protocol. You can read it here (English only).